

Jeni Wightman asked about 2000 Cornell University staff the following question:”Of the many charts (graph, map, diagram, table and ‘other’) you have seen in your life, which has been the most important, remarkable, meaningful or valuable?”. Then they were asked to attach a copy of it and are collated.
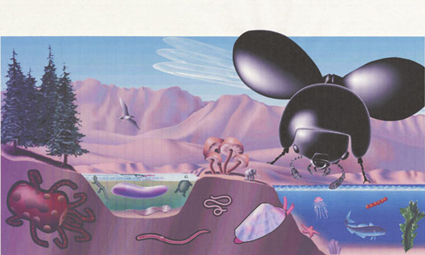
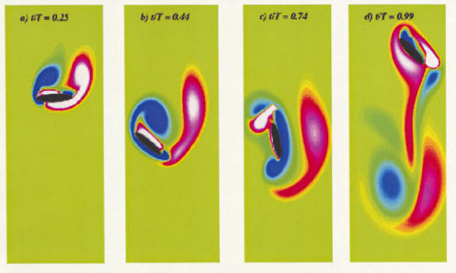
1) Vorticity field created by idealised 2-dimensional dragonfly wing. 2) Proportional representation of bioscape on Earth: fungi, birds, insect, etc. (notice the small elephant representing mammals). 3) Moore’s Law.