Learning Chinese Characters Through Illustrations

The Chinese language is composed of characters that have descended from sets of pictograms – stylized, simpflied drawings of the mountains, the sky, etc. into a few key strokes. With this as foundation it grows on to a full set of thousands of character.

It was thus quite interesting for me when I came upon Christoph Niemann’s “The Pet Dragon” work, which tells the story about, well I suppose, a pet dragon. However, unlike other story books, the illustration blends itself with Chinese characters, helping children learn and associate those (potentially) unfamiliar characters with something much more easy to understand – a picture:

pet-book-christoph-niemann

pet-book-page-11

I thought the form-association between the characters and the illustration makes a great bridge for Chinese-language learners, and certainly less boring than simple rote learning (plus, you get a free story to ride along!).

The World of 100

100-people

We have seen quite a few “if the earth was 100 people” type of illustrations, typically to make us realize the actual proportions of various metrics if we talk globally rather than our typical Western-centric impressions.

Here’s yet another set. Graphic artist Toby Wong used simple vector graphics to communicate the various metrics about the global population through a series of posters.

What does 1 Trillion look like?

With the financial crisis and the responses by US government to inject a trillion here and another trillion there, it may seem like a trillion is just a slightly bigger number that we’ve become used to. PageTutor helps us visualize the difference –

$10,000

10000

$1 million

1-million

1 billion

1-billion

1 trillion (the pallets from the 1 billion shown above are double stacked)

1-trillion

So…a trillion is really a lot of money! And, personally I was quite surprised at how small a $1 million pile can be – I’ve always have this image of at least a duffel-bag full of bills to qualify for a million – perhaps just influenced by the typical cop-and-robber movies.

Seeing Maps Everywhere

We certainly have a tendency to recognize familiar shapes from all actually-random sources: we see faces or creatures in the clouds, we imagine that there is indeed a divine intervention when Virgin Mary appeared on toasts; and now – “cartocacoethes – a mania, uncontrollable urge, compulsion or itch to see maps everywhere”:

accidental-maps

UK, Africa and Australia? Further elaboration here.

[via infosthetics]

Google Flu Trendspotting

Goog_trends_oz_die_hardGoogle Insights have been available publicly for some time. Users can enter multiple search terms and Google will report the search trends for these terms over time, and correlate it with major news articles, geographic source of search. It was typically associated with entertainment (“OZ”, “Die Hard”) variety, or perhaps political campaigning (“Joe the plumber”, “chartered school” etc.).

More recently though the underlying technology of mining the gazillions of Google searches each day was tuned towards a more social-good topic by Google.org (the charity arm of Google). One of the examples are tracking flu trends.

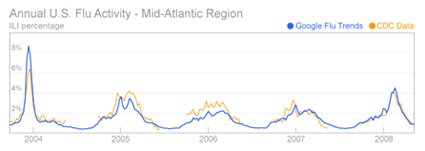
CDC [Center for Disease Control and Prevention] uses a variety of methods to track influenza across the United States each year. One method relies on a network of more than 1500 doctors who see 16 million patients each year. The doctors keep track of the percentage of their patients who have an influenza-like illness, also known as an “ILI percentage”. CDC and state health departments collect and aggregate this data each week, providing a good indicator of overall flu activity across the United States.

So why bother with estimates from aggregated search queries? It turns out that traditional flu surveillance systems take 1-2 weeks to collect and release surveillance data, but Google search queries can be automatically counted very quickly. By making our flu estimates available each day, Google Flu Trends may provide an early-warning system for outbreaks of influenza.

Here you can see the comparison of the results – it does seem like there’s a strong correlation between the actual medical report compiled by the CDC and Google’s terms. Could this be extended to a whole range of applications – epidemic outbreak, humanitarian situations, etc.?

google-trends-flu

Go to the Google.org article for a more detailed explanation.

Britain – Seen from Above


Privacy issues aside (I don’t suppose these were very much private data anyway in this day and age – particularly in Britain where surveillance is really part-and-parcel of life), this is some amazing infosthetic video showing the pulse of a nation – through its land, sea and air traffic channel, as well as phone communications. I’d look forward to the actual documentary (if I could watch it).

Africa

africa_in_perspective_map

As what’s stated in the picture, it’s quite easy to underestimate the size of Africa. Personally I’m rather surprised to see how many large countries Africa can comfortably hold –

It shows how Africa (30,3 million km²) is larger than the combination of China (9,6 million km²), the US (9,4 million km²), Western Europe (4,9 million km²), India (3,2 million km²) and Argentina (2,8 million km²), three Scandinavian countries and the British Isles (map gives no surface for these last two areas; I’ve rounded out the figures for the aforementioned regions).